Weekly Market Review & Analysis For January 24, 2022

In this week's market trading session, the Dow Jones index gained 1.3% as investors and traders chased blue-chip equities in the wake of increased market volatility. The S&P 500 index advanced 0.8% due to a solid finish on Friday. The Nasdaq Composite (big unch) ended the week flat; however, the small-cap Russell 2000 index fell 1.0%.
The eleven S&P 500 market sectors ended lower, while five were higher. The industrials with -1.5% and utilities with -1.4%, and the consumer discretionary with -1% sectors all dropped at least 1%. The energy sector with +5.0% was the most notable by gaining 5% when crude oil prices teased with $89 per barrel for the week.
The S&P 500 hopped within the 230-point price range, hitting our expended Outer Index Dip 4305 and Key Sup 4300 technical support established on Monday multiple times this week. The main worry was the Fed becoming more aggressive in tightening its policy until it slowed economic growth.
Market volatility and what you can make out of it
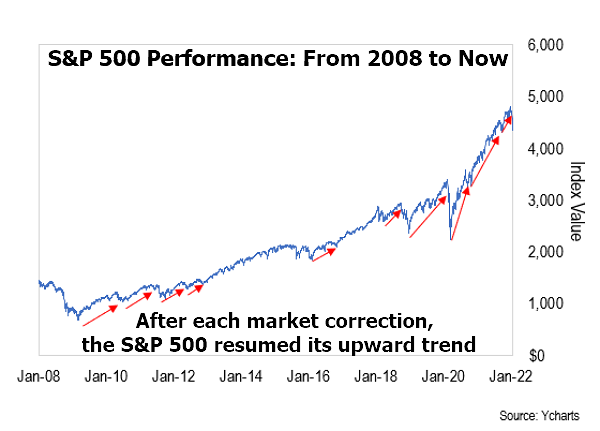
The market has been highly volatile in recent days. When markets closed on Tuesday, it was clear that the S&P 500 had logged in the worst start to the year ever.
On Monday, we witnessed the third-largest intraday market reversal for the S&P 500. At one moment, the Nasdaq Composite fell by 5% in the day. The Dow Jones index tossed out 1,100 points. However, both indices were in the green territory by the closing time.
The week prior, the reverse was true that afternoon losses erased morning gains. Prices see-saws of this kind are a sign of the unstable times. They can trigger a lot of stomach-churning moves.
So, staying on the right track in your investment portfolio and not panic selling it every time market volatility increases is an ideal way to increase your real worth portfolio.
What I acquired from trading experiences over the years is this. If you're witnessing high volatility, you must have faith in your financial plan, and you must take a step back and see the more extensive market stand.
What is the bigger vision of the market for us today? This VIX or CBOE Volatility Index has advanced in the past three years. Look at the chart below.

Check out VIX's recent behavior. However, this time, take a look at the VIX's price action before the outbreak of the fake pandemic in March 2020. You'll notice that it's far from being as erratic in the present market condition.
Compared to last week's 1,100-point swinging on the Dow Jones, what does this mean? It certainly was stomach-churning for many investors and traders. These kinds of volatile swings occur in the markets occasionally. However, as the larger picture shows us, it is far from the norm.
When faced with extreme destruction, the old 1939 wartime slogan is useful. "Keep Calm and Carry On." It's helpful to keep this in mind when the market is in turmoil. You are probably thinking about why such wild price swings are happening right now anyway?
Other market insights
The Fed funds futures formed to price in the likelihood for five rate increases this year, starting in March, after an FOMC gathering on Wednesday. Fed Chair Powell explained that the policy must cope with high inflation risks and that an accommodative policy is no longer suitable. The Advance Q4 GDP report and the PCE Price Index supported the Fed Chair's position.
The yield on the Two-year note increased 17 basis points up to close at 1.17%, while The U.S. Dollar Index rose 1.7% to finish at 97.24. The Ten-year U.S Treasury note yield increased just by three basis points and climbed to 1.78%.
Investors were not ready to let go of the market, mainly when several companies surpassed earnings. The massive discount on the prices of stocks also helped. Investors were selective and preferred high-quality stocks over those with higher risk, such as Tesla (TSLA), which took a hit, down 10% following its higher-than-expected earnings announcement.
Dow Jones leading companies Microsoft (MSFT), Apple (AAPL), Visa (V), American Express (AXP), IBM (IBM), Johnson & Johnson (JNJ), 3M (MMM), along with Dow Inc. (DOW), saw decent gains following their earnings reports. Caterpillar (CAT) was the only one to exceed Earnings per share (EPS) estimates; however, it was hit by comments on higher costs and reduced margins. Despite a comeback effort later in the week, smaller-cap Russell 2000 index still closed more down by 20% from its historical record high.
Market elsewhere
However, international stocks have also risen (according to the MSCI EAFE Index) by a less modest amount of 2.1%t. They also posted an annual gain of 7.8%. Like they have been since March, markets in emerging economies were slow in this quarter and ended with negative territory. This was due to a mix of the Chinese economy's weakness and the U.S. Dollar's recent strength.
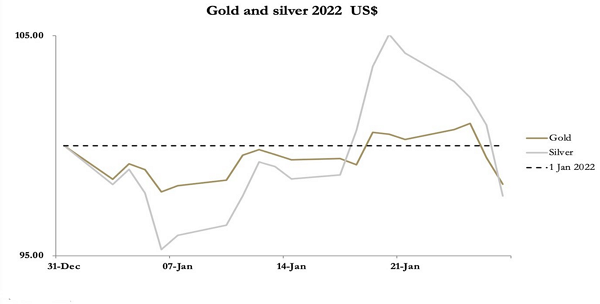
Gold and silver metals dropped sharply within this week's session in the imprint of the released minutes of the FOMC meeting, which were a big wake-up call for financial markets. The yellow metal fell $43 from last Friday's close to trade at $1791. The white metal slipped $1.82 over the same period to close $22.45, and the gold to silver ratio climbed back up, posting at 79.3, having been as lowly as 74.7 past week.

Red colors for the bitcoin and other cryptos were the sentiment of the past week; this week's charts also appear to signal a bear market. However, the week is not over yet! The coming days will decide if the descending trend to our Outer Coin Dip $30,800 is here to stay - Stay tuned.
This article was printed from TradingSig.com