Chart can help you make profitable trades
The chart is one of the biggest helpers for technical trading, but fundamental traders can benefit from them, too. There’s so much technology involved in trading that takes the work out of trades and gives you instant access to information for the smartest trade.
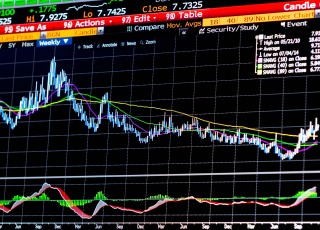
Market charts can record a market’s history, show what current conditions are, but also act as a guide to the future movement of the market. It’s a tool that helps all types of investors make an educated decision on the benefits of selling or purchasing a particular market. Charts are important for traders in the Forex, CFD's, bonds, futures, commodities, stocks, options and other markets.
These graphic representations not only record historic prices, but also record the volume, allowing the user to understand whether the investment is gaining upward or downward momentum of any significance or barely changing. While this is particularly important for the day trader, it’s also valuable information for any trader in any market. Even fundamental traders can benefit greatly by using the information from various graphs, particularly if the investment vehicle is behaving abnormally, which alerts the trader to do more research.
Chart is the most important tool for technical traders
For technical traders, graphic mapping are the most important tool. Technical traders use indicators derived with mathematical formulas as well as the movement of the graph. The graph shows the technical trader patterns and momentum of the investment and based on that information. Plus the amount of activity, he or she can make an educated decision on the future price and whether to buy, sell or hold the investment.
Technical traders, those who use graphs primarily, look for formations in the chart and their relationship to the price. The technical trader also consults the graphic mapping to find resistance lines and look for patterns such as gaps, head and shoulders or saucers. These patterns reveal a great deal about the future price of an investment.
Advent of information technology
At one time, before the advent of information technology, very few people used charts. It was left to dedicated professional investment groups or individuals and required painstakingly charting each market movement by hand. Today, technology has made it far easier and accessing the information is often just a click away. This often blurs the lines between the technical trader and the fundamental trader, with each using a bit of information from the other person’s world.
Learning to read a chart is an art, and can be easier than you think. Many of the trading sites offer free graphs and tutorials on how to use the charts provided to glean information to help you make smarter trading decisions. These diagrams can help traders overcome the fear of trading, slow down those who trade too frequently and assist the trader make more consistent beneficial trades. You can purchase your charting software, pay additional money to use those found on trading sites.
Look for trading sites that offer up-to-date, informative charting software that's appropriate for the beginning trader or the most advanced. Finding the online site that offers not only the most accurate real-time charts. But also educational tools to help you use them for maximum benefit is one of the goals every new trader should keep in mind when selecting a web-based brokerage account.
Related articles
Why The Daily Chart Will Improve Your Trading Results
Forex charts can help you make a profit
Charting forex data
Stock charts and what to look for
About bar chart
Forex charting - variations and types
Recent Posts
-
Weekly SP500 Chart and Technical Analysis
Dec 13, 25 05:29 AM
-
Weekly Euro Chart and Technical Analysis
Dec 13, 25 05:26 AM
-
Weekly Bitcoin Chart and Technical Analysis
Dec 13, 25 05:22 AM
-
The Debt Buyer Nobody Is Talking About
Apr 18, 25 05:40 AM
-
SEC (Securities and Exchange Commission): slashing the fat
Mar 19, 25 09:45 AM