Market Trend Commentary & Analysis September 4, 2019

The stock market trend ended lower yesterday to tackle the abbreviated first trading week in September. The broader S&P 500 declined 0.7%, while the DJI Average dropped 1.1%, Nasdaq Composite index also fell 1.1%, and small-cap Russell 2000 sank 1.5% on the day.
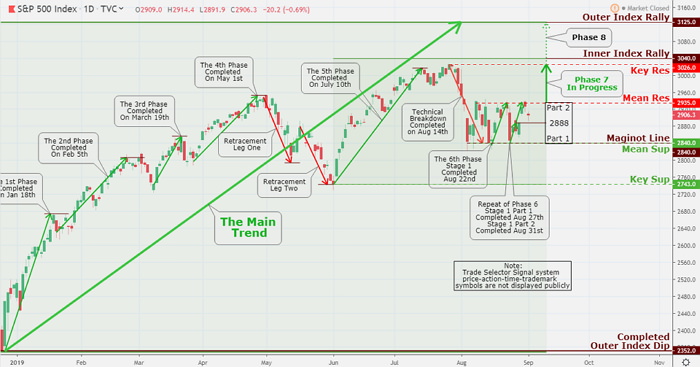
Market sellers returned to attack the first trading day of September off on a downward note, leaving a Trade Selector Signal plethora of set-up (Mean Res 2935) to pick from as the S&P 500 index trade back into the middle Stage 1 (2888) area generated on August 28.
With that in mind, there is plenty of both bullish and bearish Stage 1 pattern in action to capitalize on; it is just a matter of staying calm, being patient, and choose intelligently.
As we kick off what may be another erratic month of trading, it appears that we are presently entering the global monetary policy endgame.
There is this insouciance on the part of many when glancing at the stock market trend and presuming that just because the S&P 500 index is only a several percentage points away from its historical record high that all is fine and dandy.
However, examining underneath though has the small-cap Russell 2000 14% below its posted highs, the cyclical Dow Jones Transportation Average Index showing 12.5% below its high in 2018, and the Value Line Geometric Index of approximately 1700 stocks being depressed 15% from its closing top - Is a display of healthy market trend?.
In overseas, stock markets over the Asian-Pacific region returned in a very mixed performance throughout trading on Tuesday's session. H.K. Hang Seng Index fell by 0.4%, while Japan's Nikkei 225 Index finished barely above the fixed price line.
Meantime, the significant Eurozone stock markets all migrated to the downside on Tuesday. The German DAX index dropped by 0.4%, the French CAC 40 index slipped by 0.5%, and the U.K.'s FTSE 100 Index declined by 0.2 on the session.
WTF moment: The bankrupt European Union will request for a freeing of nearly 600 Million Euro Dollars from its emergency fund reserved for earthquakes and storms, as it designates Brexit fiasco 'A natural disaster' - is this a sign of hopelessness or what!.
As I've stated before, I believe that investors should designate about 10%-20% of their assets in physical Gold and Silver. The main reason is that Gold, in particular, maintains its status as a currency which has stood the test of over 5,000 years.
There is no doubt that realization of the supply of funny (Fiat) money is rising at a fast pace not solely because of global central banks actions to drive down the rates by issuing (printing) more money but additionally because of the accelerated and relentless rise of cryptocurrencies.
Investors globally are starting to recognize that fiat money like the United States Dollar, Euro Dollar, and cryptocurrencies don't have any backing behind them, but only the total faith of the populace – Gold will inherit the standout asset status in 2020.
Precious metals market trend
The exponential market trend increase of Gold, and Silver, as well as negative yield debt, are apparent symptoms of the global economic slowdown and diminishing confidence in central banks voodoo monetary policies.
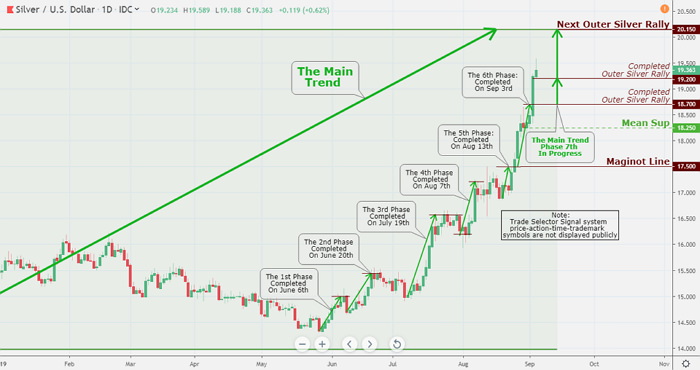
The result: What a Summer season for Silver, currently up over 35% since later part of May. The price of Silver climbed 5% on Tuesday and Gold surged to slightly over $1,550 high for the day as stocks plunged, though there were no big surprises.
Here is a look at Silver chart hitting our Outer Silver Rally $19.20 - It is presently in the middle of Trade Selector Signal long-standing transparent zone to Outer Silver Rally $20.15, and I would fancy that there is nothing can stop it now.
Cryptocurrency
It has been an exciting Labor Day weekend for the crypto segment market, with the significant cryptocurrencies all expanding in recognition to stimulating rally in Bitcoin. The coin's steadfast relative strength lastly came on September 1.
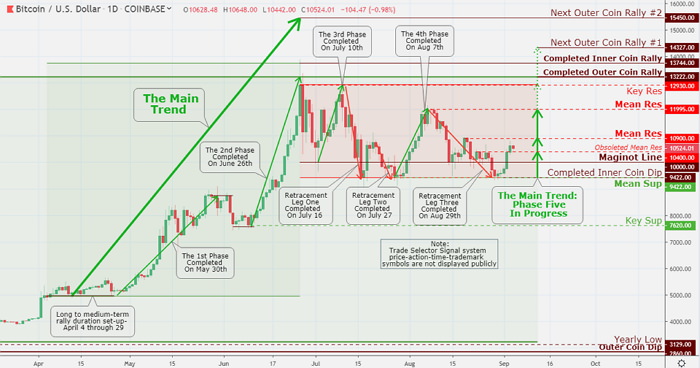
Bitcoin eventually left the completed Inner Coin Dip $9422 zone and advanced rapidly to $10,000 Maginot Line and the long-term resistance zone marked at Mean Res $10,400. The cryptocurrency bulls were happy to observe that despite the bearish pressures in the segment portrayed by mainstream pundits.
Once the token left the critical zone on the upside, the Bitcoin triggered a long predicted by Trade Selector Signal move towards next resistance point in our trend model showing Mean Res $10,900.
Even with the sustained technical market trend weakness amongst the significant crypto coins, investors and traders could re-enter the Bitcoin market within their comfort of the strict risk management controls at Maginot line and current obsoleted resistance level. The further upside resistance zones are marketed at Mean Res $10,900, and Key Res $12,930.
The Trade Selector Signal market trend model is continuously showing a short to a medium-term bullish trend; however, a breakout on the downside from the present pattern could validate a temporal short-term market trend change while major support is found at $10,000.


