Market Trend Commentary & Analysis August 31, 2019

The stock market trend ended small on Friday (August 30) in a lackluster trading session before the U.S. labor day holiday weekend. The broader S&P 500 index was up 0.1%.
The stock market began the Friday trading session near the most immeasurable price levels of the day, aided by a reprieve in trade war tensions and end of the month rebalancing which tended to choose risk assets after four continuous weekly declines.
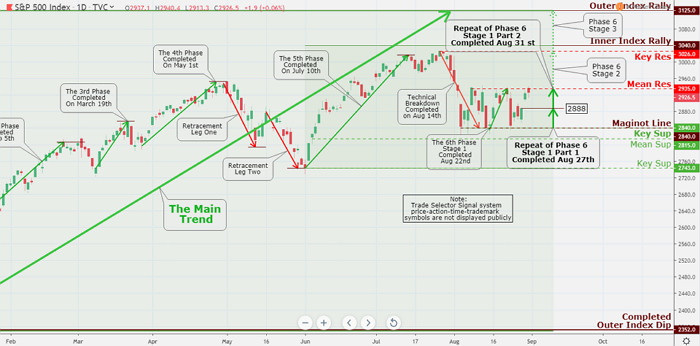
That losing streak was disrupted on Friday session. The market trend advancement brought the broader S&P 500 index five points above of its Repeat of Phase 6 Stage 1 Part 2 price marked at Mean Res 2935 initially flagged by Trade Selector Signal on August 18, 2019.
Investors and traders, who follow the traditional market news closely, will have a difficulty to see market data asymmetry at work presented by Trade Selector Signal: While the price action of the S&P 500 index had all market behavior factor in - so when will the market crash? It will only crash whenever the fewest amount of investors and traders believe it will do.
As the index approach my magic number, it started to struggle to determine its course amid missing guidance from some of its most significant technology names within the index: Communication services dropping, information technology and consumer discretionary sectors.
For the week the S&P 500 index rose 2.8%, snapping a four-week losing streak. The DJI index progressed 3.0%, the Nasdaq Composite expanded by 2.7%, and the small-cap Russell 2000 index increased 2.4%.
All eleven S&P 500 index sectors ended up higher with increases ranging from 1.8% - posted by utilities, to 3.6% print by industrials. The trade-sensitive sector indices like the Philadelphia Semiconductor Index outperformed the broader market with plus 4.1% gain, while Dow Jones Transportation Average index showing a positive 4.0% print.
S&P 500 market
This S&P 500 index chart will emerge as a surprise to even to those readers who monitor the Trade Selector Signal regularly. The reason the S&P 500 index changed upward is... is... is... well, there is one specific reason - Because price action says so.
Precious metals market trend
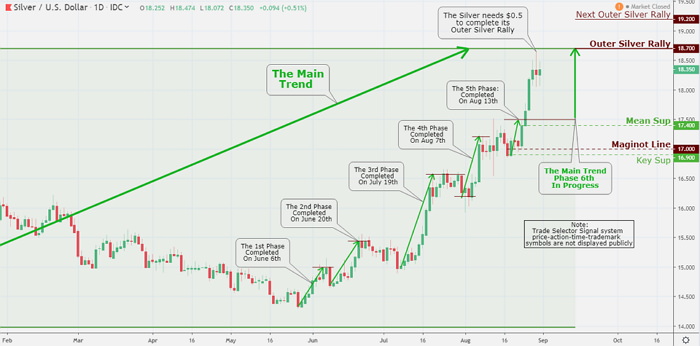
Precious metals market trend was a little subdued as we take the trading week and month to a conclusion. Gold was down little over $7 closing at $1,520, while Silver proceeded to outshine the Gold - by posting a gain of 9¢ and finishing at $18.35 on the day.
The yellow metal is up 7.9% for the month of August and a healthy gain of 19% for the year. Silver metal is up 13.1% for August and 19.1% gain for the year so far.
The Silver needs $0.5 to complete its Outer Silver Rally $18.70 - while the next Outer Silver Rally $19.20 looming above. There is a possibility we might get short-term pullback upon the above-specified completion. We will be watching and waiting with anticipation for confirmation of a Trade Selector Signal trademark completion symbol (Not publicly displayed).
Cryptocurrency
The cryptocurrency market segment had a tranquil session on Friday following two down and timid trading days, with the leading crypto coins all being somewhat more high-priced in the American market.
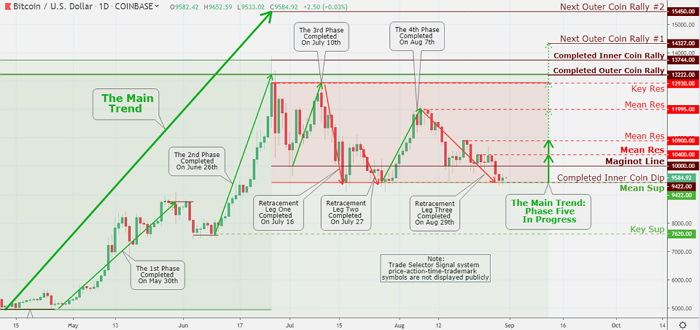
The Bitcoin enrolled in a short-term consolidation pattern trading slightly above Completed Inner Coin Dip $ 9,422, while successfully avoiding another technical breakdown on Friday.
However, despite the current quit spell, no apparent technical improvement has been made thus far, and the short-term consolidation market trend remains intact. The Bitcoin is well below its recent breakdown Maginot level, and the only crypto coin which is showing reassuring stability.
The most valuable coin is hovering about the $9,500 level at post time and securing a possible retest of the $10,000 Maginot price level which has been in the center for a couple of weeks.


