Market Commentary & Analysis December 7, 2019

As we reach the end of the trading market in the first week of this month, hot jobs news helps S&P 500 index erase early week losses - Act surprised to see here.
The broad index increased by 0.2% in a semi-direct week of trading sessions, as robust previous month employment data helped the S&P 500 market overcome a rocky start.
The small-cap Russell 2000 index advanced 0.6%, while the DJI Average dropped -0.1%. The Nasdaq Composite with -0.1% posting was unable to recover all their losses for the week.
The first week of December leaders included the S&P 500 energy sector showing +1.5%; consumer staples sector posted +0.9% gain, health care sector print a +0.9%, and the financials sector increased +0.7%.
The industrials market sector, the consumer discretionary sector, information technology sector, and real estate sector finished lower -1.1%, -0.8%, -0.4%, and 0.3%, respectively.
The trading week commenced with the S&P 500 index sinking about 70 points, or 2.3%, arising from its previous Friday (November 29) closing price level in less than two trading sessions.
The two principal catalysts were a softer than expected Institute for Supply Management Manufacturing Index for November and Trump's suggestion that a trade agreement with China most likely be better off if it paused after the next year's election.
The headlines might have been ample justifications to take some money off the table after a glorious month of November as well as the year; however, an opportunistic mindset swiftly brought into line.
Market risk sentiment was at first backed by reports that trade discussions were nearing a compromise and were later buoyed by a stronger than projected November employment release initially.

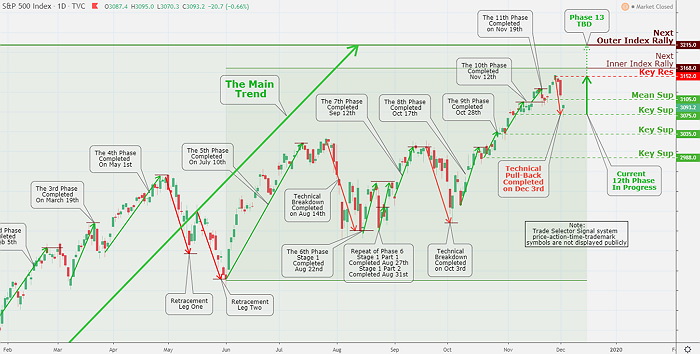
Click the Image to Enlarge
Technical Analysis and Outlook
As
we got passionately bullish on Dec 3 as soon as the Key Res $3.075
was hit. We have taken off the table 95% of our positions after the
great run as projected - 12th Phase.
Currently, the S&P
500 market development of Phase 13 or pose the intermediate-term bull
run needs to be confirmed by Trade Selector Signal BARC or TARC
signal. We will monitor the index very carefully for the next few
days. On the down side, we have Mean Sup $3,097, Key Sup $3,075, Key Sup $3.035 and Key Sup $2,988.
Management developments and other markets
Alphabet's President Sergey Brin and CEO Larry Page stepping down from management duties and hand over responsibilities to CEO of Google Sundar Pichai.
Mark Okerstrom Expedia's CEO and Alan Pickerill CFO yielded their job duties at the board's call. CEO Oscar Munoz of the United Airlines will step down as well in May of 2020 and shift his responsibilities to Executive Chairmanship.
Elsewhere United States Treasuries had unusual significant fluctuations only to finished close to their unchanged mark levels established last week.
The Two-year yield rose two basis points to finish at 1.63%, and the Ten-year yield improved one basis point to conclude at 1.84% Closing. The United States Dollar Index (DXY) fell 0.6% to close the week at 97.68.
West Texas Intermediate crude oil climbed 7.3% to close the wild trading week at $59.20 per barrow, as OPEC cartel agreed to slash its oil production by 500k barrels per day throughout the first quarter of the next year.
Precious metal market
In the previous market action, the Gold lost some ground this week, while Silver moved much lower.
From November 29 close, Gold lost just over $2 to close at $1460 last Friday, while Silver lost 47 cents finishing at $16.54. Comex exchange volume for both vital metals was subdued.
Currently, at this time of year, the situation on Comex exchange has been plus for the Gold ever since 2015. Taking into account, the commercial and bullion banks want to MTM (mark-to-market) their short positions at a favorable standing,
The big players' wish is for the Gold price to go much lower in the latter half of the year to accomplish this task. The very last active December contract expired on the last day of November, which by the way, presented an occasion to shake out the short term traders.
This undertaking reduces their short positions holdings and decreases the Gold price at the same time. Open interest (OI), a measurement of the commercial and bullion banks holdings of the short positions, could climb even much higher.
Their survival continuance will depend on their positions in the London exchange - a forward market that is always exceedingly long of naked paper and short of bullion metal.
There, nothing to discuss here. The Gold chart remains stuck and trading range-bound. See November 6 chart - https://www.tradingview.com/u/TradingSig/#search-charts.