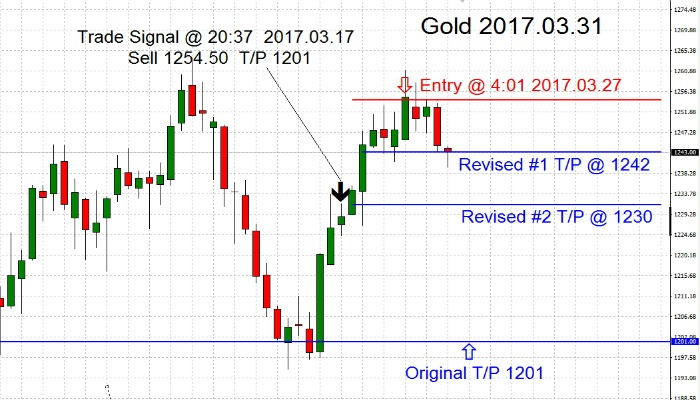
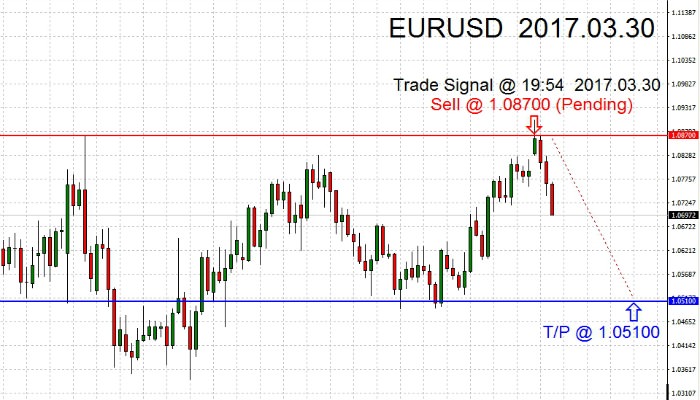
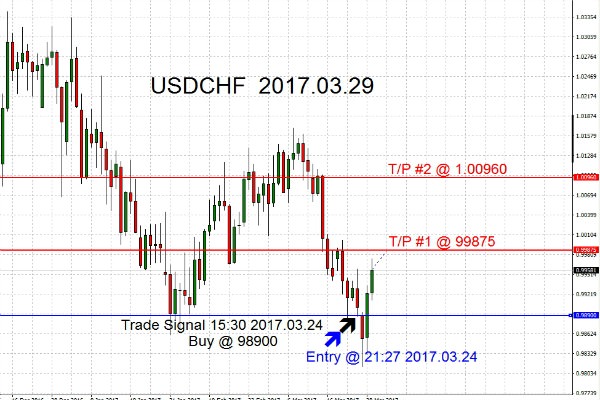
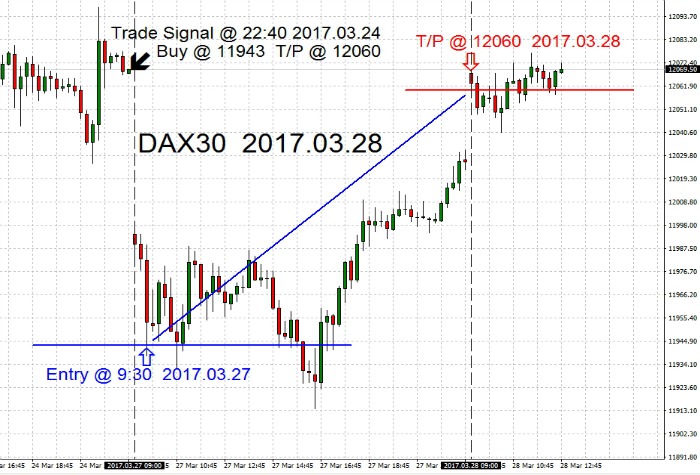
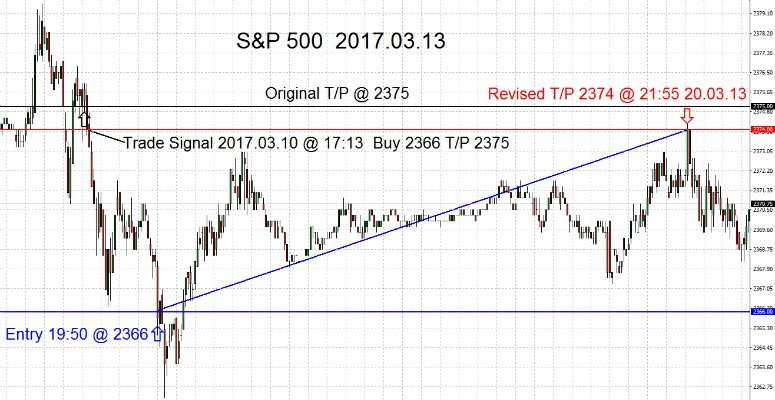
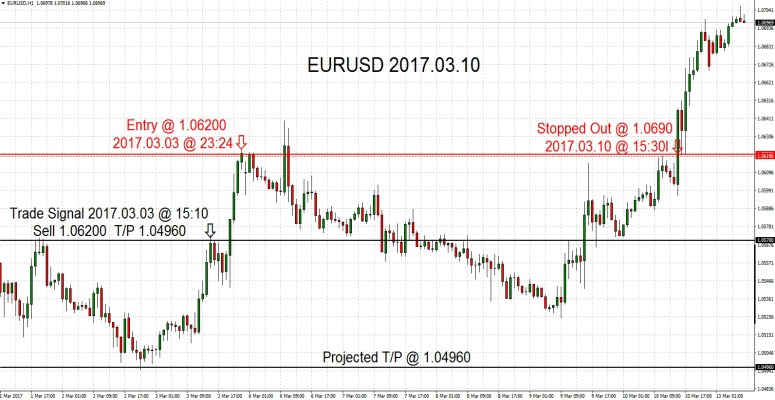
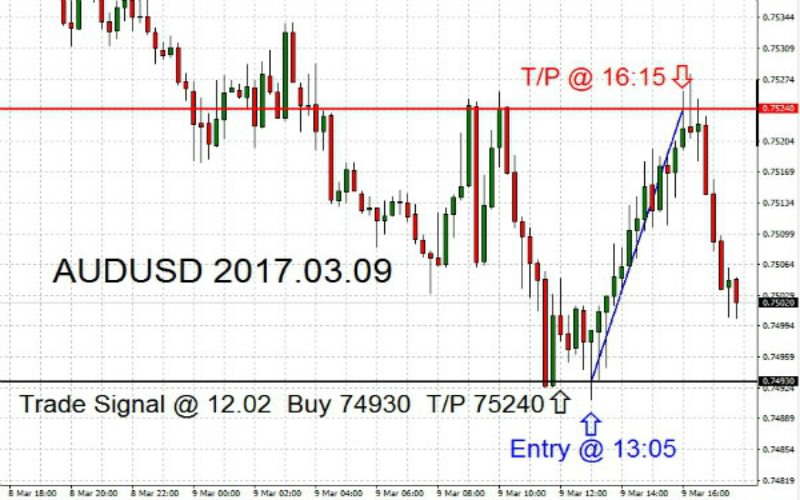
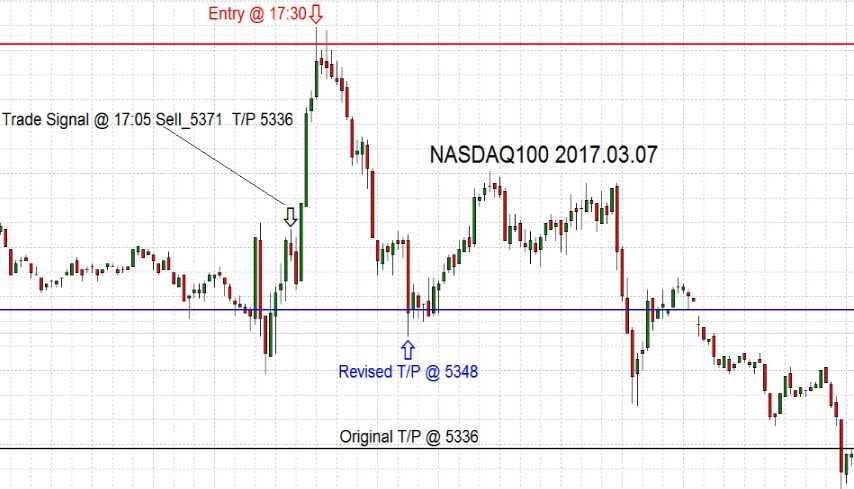
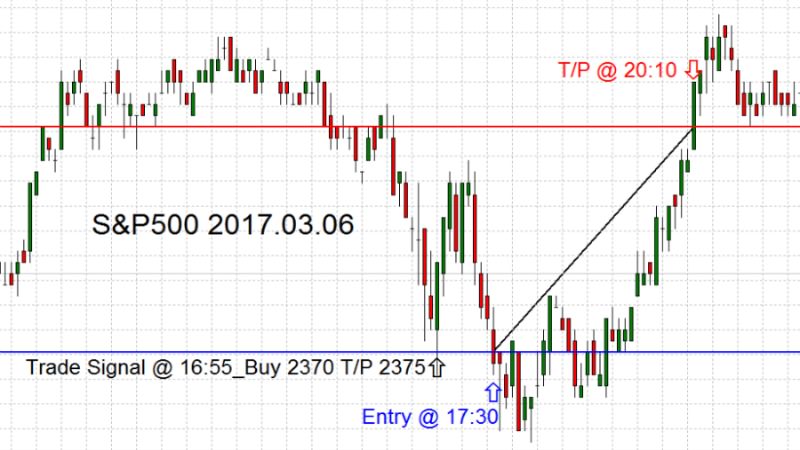
Charts Of The Day March 2017
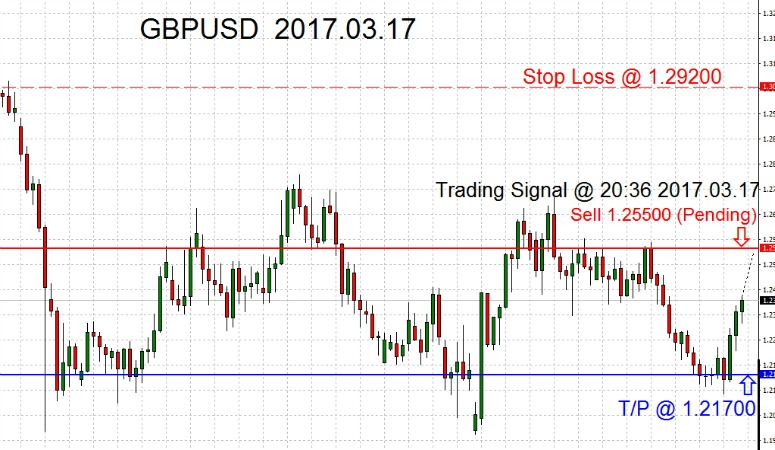
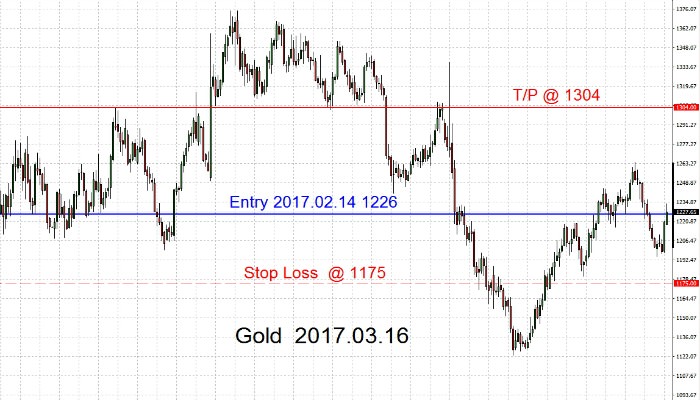
Note: Trade Selector Signal (TSS) system price-action-time-visibility is not displayed publicly.
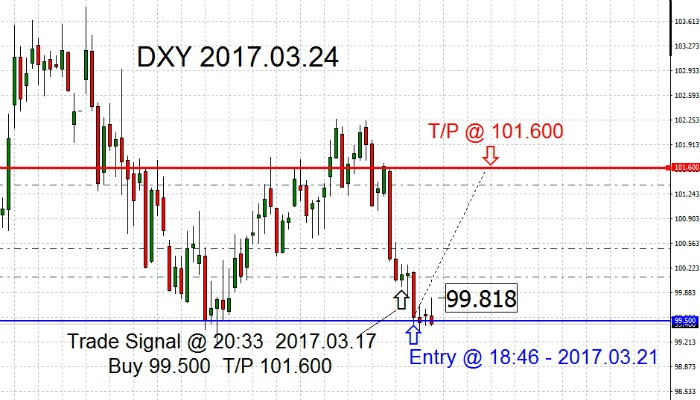
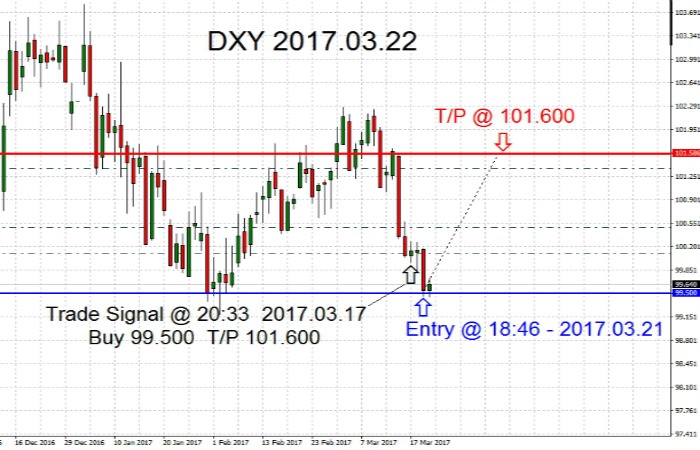
The question of the day is whether the buyers will continue to buy dollars. Currently, DXY remains stagnant at the entry level of 99.500, making intermediate High of 99.818.
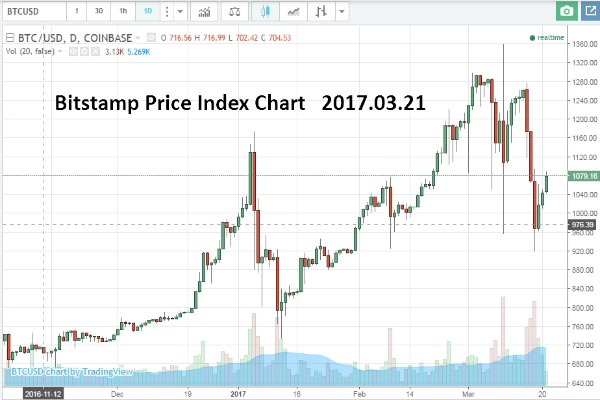
Bitcoin price began this week cruising upwards starting in the late hours of Sunday evening, currently applying an intermediate high of $1,090 on the BPI chart. However, my exchange high was $1,112, and trading price @ 1104.50.
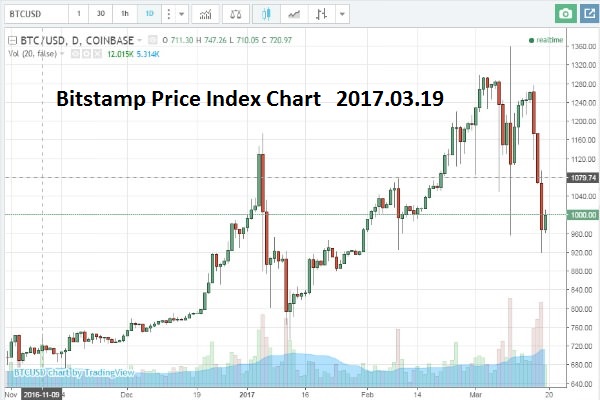
As I've stated on March 15 Bitcoin update, the correction to 1030 USD may be imminent. By 15:45 UTC (Coordinated Universal Time) on Friday, March 17, BPI (Bitstamp Price Index) numbers show the actual cryptocurrency trading around $1,160. 24-hours afterward, Bitcoin price dropped towards a 30 day low. Shedding more than $200 in the 24-hour time period to strike a low of around $939 on the BPI. As of March 19 writing, Bitcoin has bounced back to the $1000 and beyond.
Charts Of The Week March 2018
Charts Of The Day February 2018
Charts Of The Day January 2018
Charts Of The Day December 2017
Charts Of The Day November 2017
Charts Of The Day October 2017
Charts Of The Day September 2017
Charts Of The Day August 2017
Charts Of The Day July 2017
Charts Of The Day June 2017
Charts Of The Day May 2017
Charts Of The Day April 2017
Related Pages
Trading signal service for you!
Live Signal
